Examples
bench_func() method
Benchmark using the Runner.bench_func() method to
measure the time elapsed when sleeping 1 ms:
#!/usr/bin/env python3
import pyperf
import time


def func():
    time.sleep(0.001)


runner = pyperf.Runner()
runner.bench_func('sleep', func)
time.sleep() is used to simulate a real workload taking at least 1 ms.
bench_async_func() method
#!/usr/bin/env python3
import asyncio
import pyperf


async def func():
    await asyncio.sleep(0.001)


runner = pyperf.Runner()
runner.bench_async_func('async_sleep', func)
asyncio.sleep() is used to simulate a real workload taking at least 1 ms.
timeit() method
Benchmark using the Runner.timeit() method to measure the performance of
sorting a sorted list of 1000 numbers using a key function (which does
nothing):
#!/usr/bin/env python3
import pyperf

runner = pyperf.Runner()
runner.timeit("sorted(list(range(1000)), key=lambda x: x)",
              stmt="sorted(s, key=f)",
              setup="f = lambda x: x; s = list(range(1000))")
bench_command() method
Benchmark using the Runner.bench_command() method to measure the time to
run the python -c pass command:
#!/usr/bin/env python3
import sys
import pyperf

runner = pyperf.Runner()
runner.bench_command('python_startup', [sys.executable, '-c', 'pass'])
bench_time_func() method
Microbenchmark using the Runner.bench_time_func()
method to measure the performance of dict[key]:
#!/usr/bin/env python3
import time
import pyperf


def bench_dict(loops, mydict):
    range_it = range(loops)
    t0 = time.perf_counter()

    for _ in range_it:
        mydict['0']
        mydict['100']
        mydict['200']
        mydict['300']
        mydict['400']
        mydict['500']
        mydict['600']
        mydict['700']
        mydict['800']
        mydict['900']

    return time.perf_counter() - t0


runner = pyperf.Runner()
mydict = {str(k): k for k in range(1000)}
# inner-loops: dict[str] is duplicated 10 times
runner.bench_time_func('dict[str]', bench_dict, mydict, inner_loops=10)
Pass --help to the script to see the command line options automatically
added by pyperf.
The mydict[key] instruction is repeated 10 times to reduce the cost of the
outer range(loops) loop. To adjust the final result,
runner.inner_loops is set to 10, the number of times that
mydict[key] is repeated.
The repetition is needed on such microbenchmark where the measured instruction takes less than 1 microsecond. In this case, the cost the outer loop is non negligible.
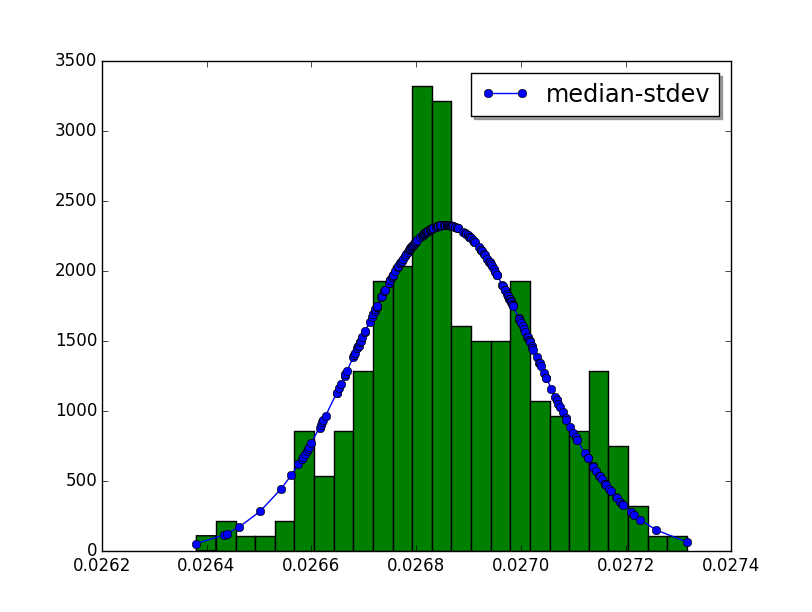
hist_scipy script
Example to render an histogram in graphical mode using the scipy module:
#!/usr/bin/env python3
import argparse
import matplotlib.pyplot as plt
import pyperf
import pylab
import scipy.stats as stats


def display_histogram_scipy(bench, mean, bins):
    values = bench.get_values()
    values = sorted(values)

    if mean:
        fit = stats.norm.pdf(values, bench.mean(), bench.stdev())
        pylab.plot(values, fit, '-o', label='mean-stdev')
    else:
        fit = stats.norm.pdf(values, bench.mean(), bench.stdev())
        pylab.plot(values, fit, '-o', label='mean-stdev')

    plt.legend(loc='upper right', shadow=True, fontsize='x-large')
    pylab.hist(values, bins=bins)
    pylab.show()


def main():
    parser = argparse.ArgumentParser()
    parser.add_argument('-n', '--bins', type=int, default=25,
                        help="Number of histogram bars (default: 25)")
    parser.add_argument('--mean', action="store_true",
                        help="Use mean-stdev, instead of median-mad")
    parser.add_argument('-b', '--benchmark')
    parser.add_argument('filename')
    args = parser.parse_args()

    if args.benchmark:
        suite = pyperf.BenchmarkSuite.load(args.filename)
        bench = suite.get_benchmark(args.benchmark)
    else:
        bench = pyperf.Benchmark.load(args.filename)

    display_histogram_scipy(bench, args.mean, args.bins)


if __name__ == "__main__":
    main()
Usage:
python3 hist_scipy.py [-n BINS/--bins=BINS] filename.json
--binsis the number of histogram bars (default: 25)
This command requires the scipy dependency.
Example:
$ python3 hist_scipy telco.json
Output:
plot
Script using matplotlib to plot values:
#!/usr/bin/env python3
import argparse
import matplotlib.pyplot as plt
import pyperf
import statistics


def plot_bench(args, bench):
    if not args.split_runs:
        runs = bench.get_runs()
        if args.run:
            run = runs[args.run - 1]
            runs = [run]
        values = []
        for run in runs:
            run_values = run.values
            if args.skip:
                run_values = run_values[args.skip:]
            values.extend(run_values)
        plt.plot(values, label='values')

        mean = statistics.mean(values)
        plt.plot([mean] * len(values), label='mean')
    else:
        values = []
        width = None
        for run_index, run in enumerate(bench.get_runs()):
            index = 0
            x = []
            y = []
            run_values = run.values
            if args.skip:
                run_values = run_values[args.skip:]
            for value in run_values:
                x.append(index)
                y.append(value)
                index += 1
            plt.plot(x, y, color='blue')
            values.extend(run_values)
            width = len(run_values)

            if args.warmups:
                run_values = [value for loops, value in run.warmups]
                index = -len(run.warmups) + 1
                x = []
                y = []
                for value in run_values:
                    x.append(index)
                    y.append(value)
                    index += 1
                plt.plot(x, y, color='red')

        mean = statistics.mean(values)
        plt.plot([mean] * width, label='mean', color='green')

    plt.legend(loc='upper right', shadow=True, fontsize='x-large')
    plt.show()


def parse_args():
    parser = argparse.ArgumentParser()
    parser.add_argument('-b', '--benchmark')
    parser.add_argument('--split-runs', action='store_true')
    parser.add_argument('--skip', type=int, help='skip first SKIP values')
    parser.add_argument('--warmups', action='store_true')
    parser.add_argument('--run', metavar='INDEX', type=int,
                        help='only render run number INDEX')
    parser.add_argument('filename')
    return parser.parse_args()


def main():
    args = parse_args()
    if args.benchmark:
        suite = pyperf.BenchmarkSuite.load(args.filename)
        bench = suite.get_benchmark(args.benchmark)
    else:
        bench = pyperf.Benchmark.load(args.filename)
    plot_bench(args, bench)


if __name__ == "__main__":
    main()
Usage:
$ python3 plot.py telco.json
$ python3 plot.py -b telco suite.json   # only render telco benchmark
export_csv
Script exporting the average of run values as CSV:
#!/usr/bin/env python3
import argparse
import csv
import pyperf
import statistics


def export_csv(args, bench):
    runs = bench.get_runs()
    runs_values = [run.values for run in runs if run.values]

    rows = []
    for run_values in zip(*runs_values):
        mean = statistics.mean(run_values)
        rows.append([mean])

    with open(args.csv_filename, 'w', newline='', encoding='ascii') as fp:
        writer = csv.writer(fp)
        writer.writerows(rows)


def parse_args():
    parser = argparse.ArgumentParser()
    parser.add_argument('-b', '--benchmark')
    parser.add_argument('json_filename')
    parser.add_argument('csv_filename')
    return parser.parse_args()


def main():
    args = parse_args()
    if args.benchmark:
        suite = pyperf.BenchmarkSuite.load(args.json_filename)
        bench = suite.get_benchmark(args.benchmark)
    else:
        bench = pyperf.Benchmark.load(args.json_filename)

    export_csv(args, bench)


if __name__ == "__main__":
    main()
Usage:
$ python3 plot.py telco.json telco.csv
$ python3 plot.py result.json -b telco telco.csv